In layman's terms...
Intense light rips apart ordinary materials \(-\) that is, strong light fields surrender so much energy to matter that electrons are ejected from their mother ions. But everyone knows that electrons can be freed (ionized) with ordinary light, as long as light's frequency is sufficiently high. This is why we wear sun screen during the summer, when high-frequency ultraviolet (UV) radiation is abundant. So what's unique about an intense light-matter interaction? And how is it that the applications of intense light range from lightning control to the visualization of electron and molecular dynamics?
The enabling technology: ultrafast lasers
Before diving into the exotic physics of intense laser-matter interactions, we should appreciate the technology that makes it all happen. Ultrafast laser systems are capable of generating ultrashort pulses with durations on the order of femtoseconds (\(1\) fs \(= 10\)\(-15\) s) owing to mode-locked laser cavities, which consist of gain media with broad bandwidths (reliably amplifying many colors) and a mechanism for stabilizing the phase relationship between the colors (e.g., through electro-optic modulators or materials exhibiting saturable absorption) [1].
An important consequence of the short pulse duration is the resulting high peak powers, which occur even at low pulse energies! For example, a commercially-available Titanium–sapphire laser system with a repetition rate of \(80\) MHz (pulses are emitted every \(12.5\) ns) and an average power of \(100\) mW (measured using a typical power meter) will produce pulses containing about 1 measly nanojoule of energy. However, if the pulse duration is \(10\) fs, then the instantaneous (peak) power of the pulse is \(125\) kW! That's a result of simple physics: power is energy over time, so confining even a small amount of energy into a short time interval can have profound effects on peak power.
But that's not the end of the story. Modern ultrafast lasers are made to be even more powerful through chirped-pulse amplification (CPA), a Nobel Prize
winning technology [2]. CPA
enables the amplification of ultrashort pulses by preventing damage to the optics of the system (a typical complication at very high powers),
and the strategy is surprisingly simple. The technique is illustrated in Figure 1.
A pair of gratings is used separate the spectral content (the colors) of the pulse in time. For example, long wavelengths might be sent to the front
of the pulse, and short wavelengths to the rear. This temporal redistribution of colors can broaden the pulse duration by a factor of
\(\sim10^5\), which in turn reduces the peak power by the same factor. The reduced power allows us to amplify the pulse energy using the gain medium
(Titanium–sapphire in our example) without damaging the crystal. Following the amplification, a second pair of gratings is used
to recompress the pulse back to femtosecond durations. In many commercially available amplified systems, a final pulse energy
of a few mJ can yield powers on the order of \(100\)s of GW \(-\) that's enough for a myriad of exotic laser-matter interactions.
And so we can study nonlinear optics.
Now, what do we mean by nonlinear?
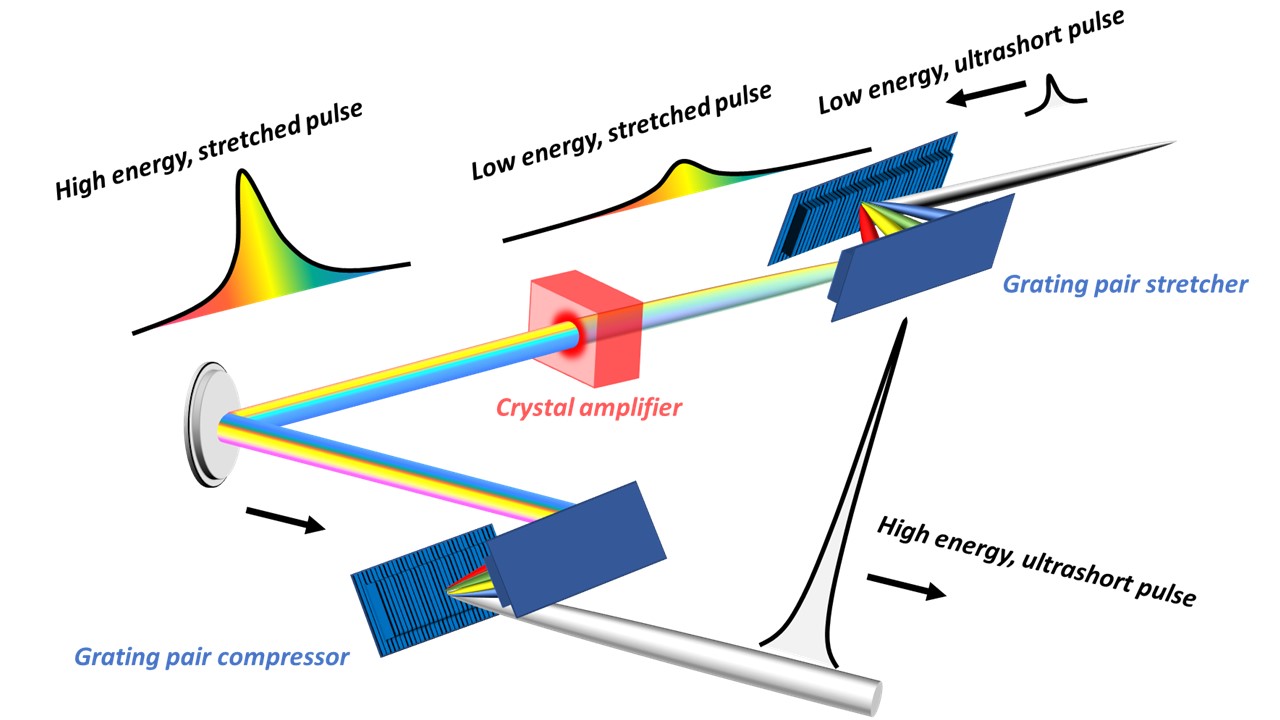
Figure 1: The important steps of chirped pulse amplification are shown. An ultrashort laser pulse is temporally broadened using a grating pair (stretcher), which separates the colors of the pulse in time. With a long pulse duration, the power is low enough to safely amplify the pulse energy in the gain medium (crystal amplifier). A second grating pair (compressor) temporally recompresses the beam, producing an ultrashort and ultrapowerful laser pulse.
What is the nonlinearity?
When we say that a system is linear, we mean that the system's response to some input varies in direct proportion to that input's strength. In linear optics, the material response to an electric field \(E\) (of an electromagnetic wave) is described by the resulting material polarization: \begin{equation} P = \epsilon_0\chi E \tag{1} \end{equation}
Here \(\epsilon_0\) is the permittivity of free space (a fundamental constant) and \(\chi\) is the material's susceptibility (which quantifies its tendency to polarize). And what's polarizing? The electron clouds that surround the nuclei. That's intuitive: electrons are redistributed in the presence of a field, and the magnitude of the effect scales linearly with the field strength (e.g., twice the field strength will induce twice the polarization). Coupled with Maxwell's equations, this polarization response is the fundamental starting point of conventional optics, describing important physical processes like diffraction (spreading of light in space) and dispersion (spreading of pulses in time). We'd simply solve a linear wave equation to predict the evolution of a light field in a linear medium.
Now crank up the power. Once the beam is intense enough, interesting things start happening. The material's polarization \(P\) no longer scales in direct proportion to \(E\). Instead, a nonlinear dependence on the field strength arises: \begin{equation} P = \epsilon_0(\chi E + \chi^{(2)} E^2 + ... + \chi^{(m)} E^m) \tag{2} \end{equation}
Now the polarization scales as the field raised to varying powers \(m\), with each term weighted by a respective
\(m^{th}\) order susceptibility \(\chi^{(m)}\). One might envision this as the electron
cloud exhibiting a more complicated redistribution in response to the electric field of the intense pulse. Why? In part, this can happen
because a strong electric field will drive electrons very far from their mother ions \(-\) so far that they might start interacting with neighboring
atoms/ions, which alter the local electromagnetic environment of the cloud.
More technically, a linear polarization response to an electric
field can be described by treating an electron as a linear harmonic oscillator. Just like a mass on a spring obeying Hooke's law, in the linear regime
the nucleus is assumed to exert a force on the electron that is proportional to the electron's displacement from the nucleus.
In contrast, an intense field warrants an anharmonic oscillator approach that describes the restoring force using terms beyond the linear
[3].
This is the basis of nonlinear optics (to be technical once more, perturbative nonlinear optics).
So fundamentally, in nonlinear optics the electron cloud responds to an intense electromagnetic field in a nonlinear way.
This simple fact manifests as a multitude of physically novel and technologically appealing effects. In particular, it is useful to consider
the unique features of intense ultrashort pulse propagation in the spatial, spectral and temporal domains.
Spatial effects
The most well-known spatial nonlinear effect is self-focusing, which, as implied by the term, describes the focusing of
an intense beam on its own. No lens is involved! This is very strange indeed, since all light (including laser light) naturally diverges
as a consequence of diffraction (a linear effect). Let's try to make this more natural with some simple physical intuition.
Fundamentally, self-focusing occurs because an intense beam modulates a material's refractive index during propagation.
That modulation results in a refractive index of a higher value, which scales
directly with the intensity \(I\) (and in turn scales quadratically with the field
strength \(I \sim E^2\)). We call this the optical Kerr effect. To understand how this influences the focusing
of the beam, we can write the phase acquired by the beam as:
\begin{equation}
\Phi = kz - \omega_0 t \tag{3}
\end{equation}
Here \(k\) is the wavenumber, \(z\) is the propagation distance, \(\omega_0\) is the central angular frequency, and \(t\) is time. We can express the wavenumber in terms of the linear refractive index \(n_0\) and the change in the index due to the nonlinear (intensity-dependent) refractive index \(\Delta n = n_2I\), where \(n_2\) is the nonlinear index coefficient (a material-dependent factor): \begin{equation} k = \frac{n\omega_0}{c} = \frac{(n_0 + n_2I)\omega_0}{c} \tag{4} \end{equation}
Here \(c\) is the speed of light. Now the intensity of most laser beams is highest near the beam's cross-sectional center, with a peak value \(I_0\), and the intensity falloff is often described as a Gaussian across the profile \(I(r) = I_0e^{-2r^2/w_0^2}\). Here \(r\) is the radial coordinate along the direction of the beam's cross-sectional profile and \(w_0\) is a characteristic radius (the value in space, relative to \(r = 0\) μm, at which the intensity of the pulse falls to a value of \(I_0/e^2\), where \(e\) is Euler's number). This radial variation naturally extends to the spatial component of the phase: \(\Phi(r) \propto k \propto I \propto e^{-r^2}\). With some familiarity of geometrical optics, one might recognize that such a phase front resembles that induced by a focusing lens! Recall that a focusing (convex) lens is thickest near its center, so rays propagating near the center acquire more optical phase than those at the outskirts, resulting in a converging wavefront. Figure 2 illustrates the idea: nonlinear self-focusing overcomes the beam's natural tendency to diverge!
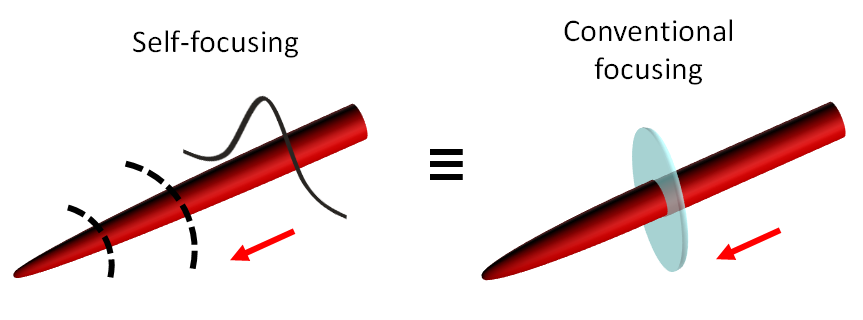
Figure 2: Self-focusing occurs due to the optical Kerr effect, which produces a phase front resembling that induced by a converging lens.
But self-focusing can't go on indefinitely, can it? As the beam converges, it becomes more intense, driving the nonlinearity further, which in turn further enforces focusing. A classic example of positive feedback. Indeed, without a mechanism to halt the process, the light field would collapse into a singularity, with the field strength tending towards infinity. However, nature doesn't allow this to happen. Instead, when the peak intensity becomes high enough, the field begins to rip away electrons from neutral atoms. A soup of ions and free electrons called a plasma is produced. Crucially, the plasma reduces the refractive index experienced by the beam. The higher the plasma density, the lower the index. Since the field strength is highest at the beam's center, more plasma is formed there. Thus, the phase front acquired by the beam due to the plasma distribution is opposite to the case of self-focusing, resulting in plasma-induced defocusing. Just like a diverging (concave) lens! For example, at a central wavelength of \(\lambda = 800\) nm in air, a great deal of plasma (with a density typically greater than \(10\)\(17\) cm-3) will be produced when the beam reaches an intensity of \(I \sim 5 \times 10\)\(13\) W/cm2 (at a cross-sectional diameter of \(D \sim 100\) µm [4]). I show this effect in Figure 3.
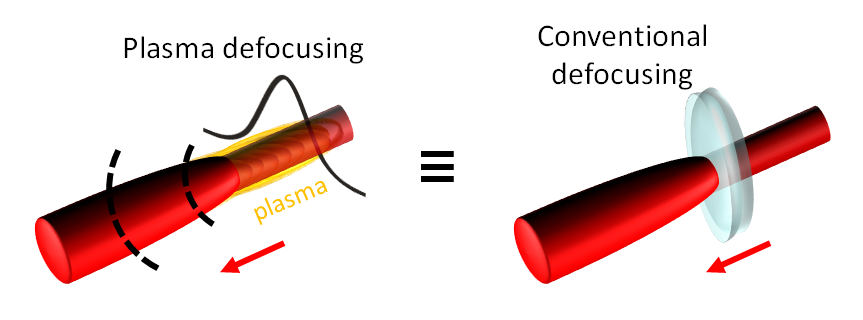
Figure 3: Plasma-induced defocusing produces a phase front resembling that induced by a diverging lens.
After plasma-induced defocusing, the beam's intensity is reduced because (a) the beam is spatially diverging and (b) the beam has given up some of its energy to the material in order to free the electrons. However, if not too much energy has been lost to plasma production, then the beam's intensity may be large enough to induce another self-focusing event! This would be followed by plasma defocusing, then more self-focusing, and so on. Finally, when the medium has absorbed more energy than that required for self-focusing, the beam naturally diffracts away. That all makes sense, but let's not overlook the remarkable consequence: over the course of the focusing/defocusing cycles, the beam has sustained a confined spatial profile on the order of \(100\)s of micrometers over an extended range, despite its natural tendency to diverge due to diffraction. This phenomenon is called laser filamentation [5], and it's a hallmark of modern nonlinear optics. Filamentation is illustrated in Figure 4.
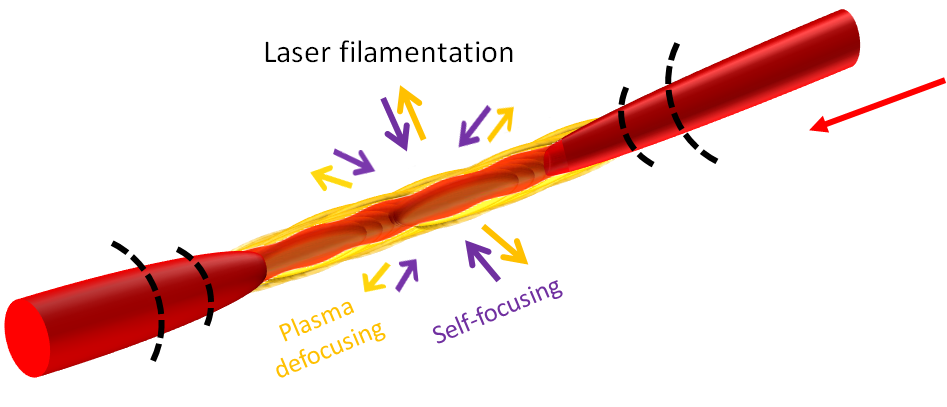
Figure 4: Laser filamentation occurs when nonlinear self-focusing is balanced by diffraction and plasma-induced defocusing. In this way, an ultrashort pulse can sustain a confined spatial profile over an extended range, which is impossible in the linear optical regime.
Aside from the physical novelty, these nonlinear spatial dynamics offer a suite of technological applications. Laser filaments of several kilometers in length have been demonstrated in the atmosphere [6]. Since there is an accompanying column of plasma generated over a long distance, filaments can be used for lightning guiding [7] \(-\) that's right, there's a potential here for directing the flow of charges in a lightning strike along a specified path. This offers protection against lightning strikes and other erratic electrical events like high voltage capacitor discharges [8]. One day ultrafast lasers might be routinely mounted on aircrafts, both for applications in weather control and to reduce the drag experienced by the craft, enabling more fuel-efficient supersonic flights [9].
Spectral effects
The spectral dynamics of a typical beam of light propagating in the linear regime are quite bland: generally
the colors that comprise the beam will either remain unaltered during propagation, or certain colors will be extinguished due
to absorptive media. Usually new colors will not be added to the beam during linear propagation. On the other hand,
nonlinear propagation often manifests a wildly broader spectrum compared to the initial spectral content.
This spectral broadening is often called supercontinuum generation
[3,
10,
11]
due to the broadband continuum of light
generated about the central wavelength of the ultrashort pulse. Although the mechanism of supercontinuum generation is not fully
understood, at its most basic level the process can be explained in terms of the optical Kerr effect, leading to self-phase modulation.
In an analogous way to spatial phase modulation, which leads to a converging wavefront (see spatial effects above), an ultrashort pulse can modulate its
own phase in the time domain! Consider the temporal intensity profile of a typical ultrashort pulse, which can be described over time using a Gaussian function:
\(I(t) = I_0e^{-2t^2/\tau^2}\). Here \(I_0\) is the peak intensity and \(\tau\) is
the pulse duration (the value in time, relative to \(t = 0\) s, at which the intensity of the pulse falls to a value of \(I_0/e^2\)). So the beam has a phase that
is time-dependent, expressed as:
\begin{equation}
\Phi(t) = \frac{[n_0 + n_2I(t)]}{c}\omega_0z - \omega_0 t \tag{5}
\end{equation}
To describe the variation of the beam's spectral content over time, we can calculate the instantaneous angular frequency \(\omega_i\) of the pulse, simply by taking the (negated) time derivative of the phase \(-\frac{\partial \Phi(t)}{\partial t}\): \begin{equation} \omega_i(t) = -n_2\frac{\partial I(t)}{\partial t}\frac{\omega_0z}{c} + \omega_0 \tag{6} \end{equation}
The negative sign in the definition above is used simply for notational convenience, which allows us to describe our central frequency \(\omega_0\) as a positive quantity. Here's how to interpret the form of \(\omega_i\): without a nonlinear (\(n_2I\)) contribution, the spectrum of the pulse is unaltered, always taking a central value of \(\omega_0\). However, the derivative of \(I(t)\) is nonzero. Therefore, the spectral content of the pulse will be modified based on the temporal profile of the pulse! For some intuition, consider Figure 5.
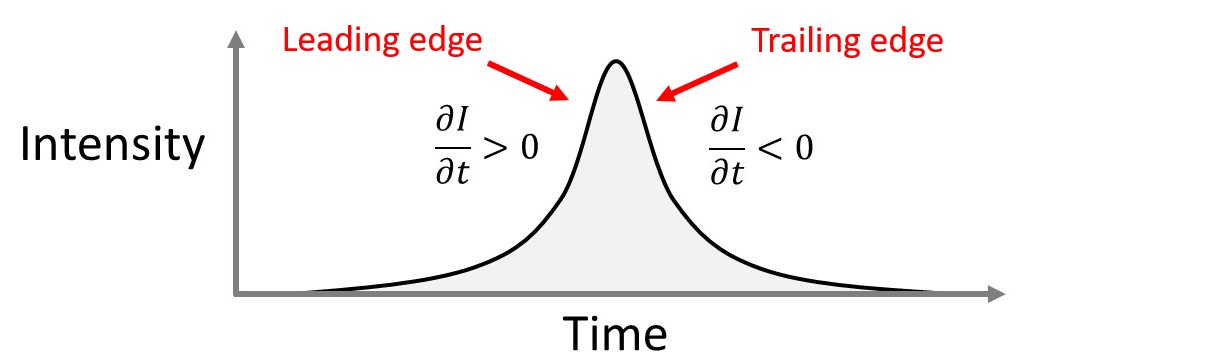
Figure 5: A pulse with a Gaussian temporal profile has an increasing intensity (positive slope) near its leading edge, and a decreasing intensity (negative slope) near the trailing edge.
At the front of the pulse (the leading edge, near lower values of time), the intensity is growing in time towards the center of the pulse. Thus, the derivative of the intensity in time is positive: \(\frac{\partial I}{\partial t} > 0\). According to our equation for the instantaneous frequency, this corresponds to a low-frequency contribution (the nonlinear term is subtracted from the central frequency, so \(\omega_i < \omega_0\)). In other words, red (lower frequency, longer wavelength) photons are generated, and this occurs at the leading edge of the pulse. At the trailing edge, we have the opposite effect: \(\frac{\partial I}{\partial t} < 0\), so a positive contribution is made to the instantaneous frequency (\(\omega_i > \omega_0\)), which means blue (higher frequency, shorter wavelength) photons are created at the back of the pulse. Overall, the pulse undergoes spectral broadening, with a specific time-color distribution. Figure 6 depicts the effect of self-phase modulation, leading to supercontinuum generation.
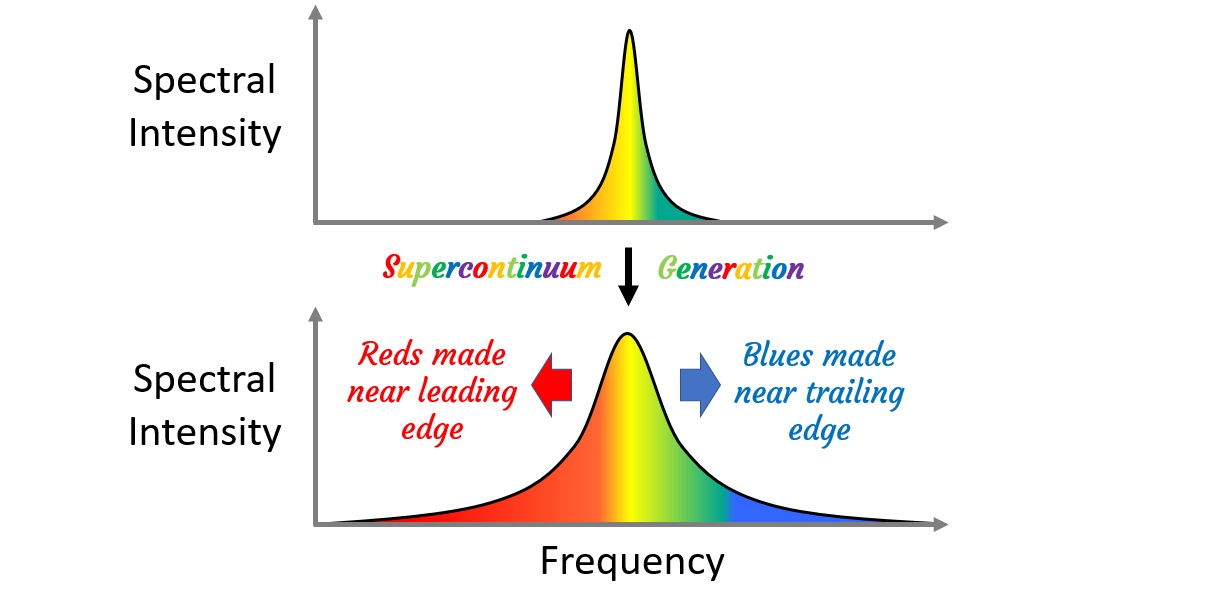
Figure 6: Supercontinuum generation results in the spectral broadening of an ultrashort pulse. Lower frequencies are generated near the leading edge of the pulse, and higher frequencies are generated near the trailing edge.
Supercontinuum spectra can extend over several micrometers both in air
[12]
and transparent solids [13],
which makes for a far-reaching scope of applications. Spectrally-broadened pulses are useful for remote sensing of gases
[14],
optical communication [15],
optical clocks [16],
and an array of biomedical imaging technologies
[17,
18]
.
Furthermore,
supercontinuum generation is well-established as a tool for fundamental studies in the physical, chemical and biological
sciences [19].
Another noteworthy nonlinear process leading to novel spectral dynamics is called harmonic generation. In contrast to supercontinuum generation, harmonic generation results in the production of discrete frequency components at integer multiples of the input frequency. Harmonic generation provides a viable approach for the generation ultrashort, tabletop ultraviolet and x-ray pulses [20]. In essence, harmonic generation occurs due to the violent wiggling of electrons by the intense light field (the classical picture), or the simultaneous annihilation of multiple input photons and the creation of a higher-frequency photon (the quantum picture). For example, in the case of second-harmonic generation, \(2\) incoming photons at frequency \(\omega\) are annihilated and a single photon at frequency \(2\omega\) is produced, as shown in Figure 7. The process generalizes to \(n\)\(th\)\(-\)harmonic generation (where \(n\) is an integer), and although the efficiency generally drops off with large values of \(n\), harmonic generation on the order of \(n = 100\) is experimentally feasible! Applications include the mapping of electron dynamics in atomic systems [21] and the optical probing of band structure in solid materials [22].
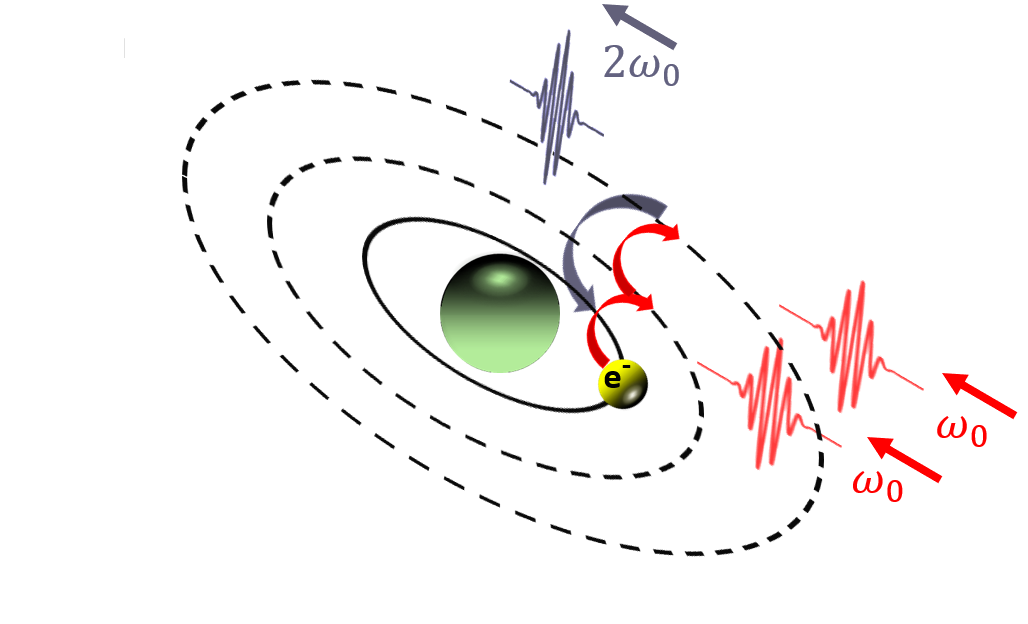
Figure 7: Second-harmonic generation occurs when two photons of frequency \(\omega\) are annihilated, exciting an electron in the process, followed by relaxation of the electron and production of a new photon at frequency \(2\omega\).
Temporal effects
The temporal structure of any waveform is inherently linked to its spectral content. At the most fundamental level, we can say that pulses with broader spectra have shorter time durations. Mathematically, we can think of the spectral bandwidth \(\Delta\omega\) and pulse duration \(\Delta t\) as conjugate Fourier variables, which physically manifests as a variant of the all-important Heisenberg uncertainty principle: \begin{equation} \Delta\omega\Delta t \geq 1/2 \tag{7} \end{equation}
The implication? Broadband spectral expansion during supercontinuum generation is often accompanied by
a shortening of the pulse duration, providing a useful mechanism for temporal compression of ultrashort pulses.
Once a broad spectrum is generated, it's important to consider the effect of group velocity dispersion, which
describes the speed at which the colors of the pulse travel.
Group velocity dispersion is material-dependent, and it is a linear process. However, its interplay with nonlinear effects such as
supercontinuum generation makes it a crucial component in the unique temporal dynamics of intense light pulses.
The dispersive nature of a material is one of two types, either normally dispersive, where long wavelengths propagate
faster than shorter ones, or anomalously dispersive, where short wavelengths outpace longer ones.
Figure 8 demonstrates the effect in a normally dispersive material.
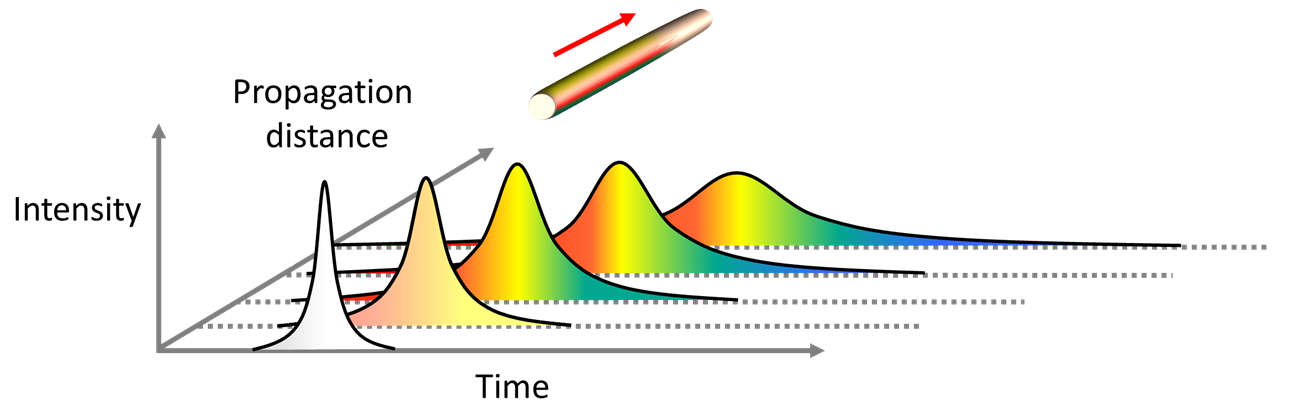
Figure 8: Group velocity dispersion causes different colors of a laser pulse to travel at different speeds. In a normally dispersive medium, long wavelengths travel faster than short wavelenghts, resulting in the temporal spreading of a pulse during its propagation through the material.
Now recall that during supercontinuum generation, longer wavelengths are created at the front of the pulse. Therefore, if supercontinuum generation occurs in an anomalously dispersive medium, pulse compression can be amplified: the long wavelengths generated near the front of the pulse are swept towards the back of the pulse, while the short wavelengths made in the rear are swept forward, leading to further compression [23]. A myriad of other physically exotic processes can lead to compression, including plasma defocusing of the trailing edge [24], a steepening of the trailing edge due to the Kerr effect [25], and high-harmonic generation, which might one day enable the generation of pulses with durations on the order of zeptoseconds [26](\(1\) zs \(= 10\)\(-21\) s!).
Finally, how can we use these ultrashort pulses to study novel physical processes? To gain a sense of the possibilities, consider a classical problem in photography. In 1878, the English-American photographer Eadweard Muybridge was interested to know whether a galloping horse ever becomes completely airborne during its gait. Do all four feet ever completely lift off the ground at any one moment in time? The question was hotly debated, since the unaided human eye is not able to resolve events that evolve too quickly, including the trotting or galloping of a horse. Muybridge's solution? A series of cameras configured to capture the horse during its gait, providing an effective frame rate that is high enough to accurately capture the motion of a galloping horse. Through his efforts, Muybridge was able to show that the animal indeed becomes fully airborne. His work, called The Horse in Motion [27] (see Figure 9) is now considered to be a crucial step in the development of the motion picture [28].
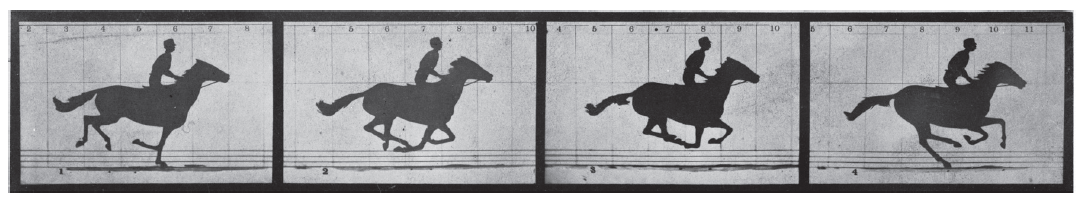
Figure 9: The Horse in Motion [27] by Eadweard Muybridge. Taken in 1878, these photographs confirmed that a horse becomes completely airborne during its gait.
Using ultrashort pulses, we can extend these ideas to the ultrafast visualization of exotic physical systems that evolve
very rapidly. To completely capture the physics of a system that changes quickly in time, we require
a visualization mechanism that (a) has fine enough time resolution compared to the pace of the system's evolution
and (b) can record the system over a long enough time so that all important events are measured.
This is analogous to speed-racing movie that captures the entire race without blurry frames.
However, instead of a race, we are interested in measuring dynamically-evolving microscopic events such as
plasma-induced particle acceleration [29]
or laser-induced fusion [30].
A myriad of ultrafast visualization schemes have been demonstrated, including
frequency-domain holography (FDH) [31],
single-shot supercontinuum spectral interferometry (SSI) [32],
and multi-object-plane phase-contrast imaging (MOP-PCI) [33].
Although most of these techniques rely on rather sophisticated forms of microscopy (see my primer on digital holography), at the heart
of ultrafast visualization is a simple strategy called the pump-probe method, shown in Figure 10.
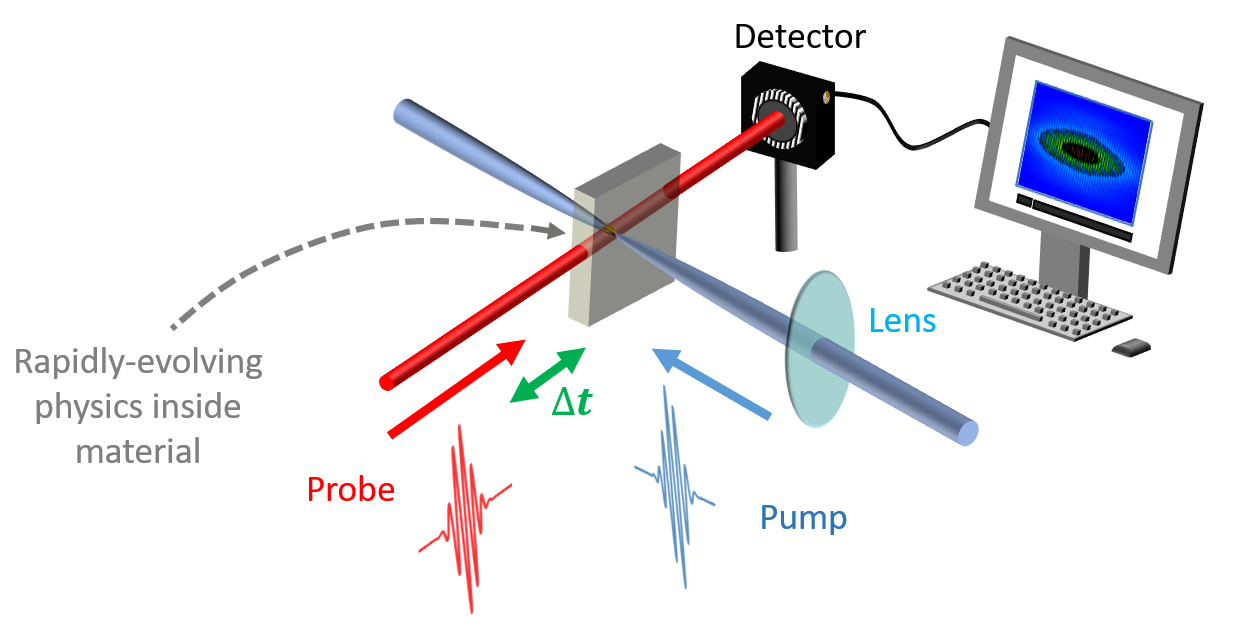
Figure 10: A simple pump-probe experimental setup is shown here. A powerful pulse (called the pump) is focused into some medium, inducing an ultrafast light-matter interaction. A second pulse (called the probe) is directed into the interaction region, where it is modulated. The modulated probe is then measured using a detector at various delays Δt relative to the pump.
The pump-probe technique relies on a well-timed interaction between two pulses: the pump and the probe. The pump pulse is usually more energetic than the probe,
and a lens is often used to focus the pump into a medium of interest. The pump modifies the medium in some way. For example, it can generate plasma.
And that plasma isn't stagnant \(-\) it's a sea of ions and free electrons in a state of rapid evolution, including the abrupt generation of pressure
(shock) waves, an acceleration of electrons in the presence of the pump electric field, and finally a recombination of electrons to their
mother ions. That's alot of interesting physics to study, but to describe these processes we require a visualization tool with a "frame rate"
on the time scale of these events: femtoseconds! Enter the probe: a second ultrashort pulse is directed through the plasma at a specific time
delay relative to the pump, which is controlled by sending the probe over an optical delay line. For each delay, the plasma
modulates the probe in a slightly different way (for example, absorbing or defocusing the probe). This modulation can be captured using
a detector such as a charge-coupled device camera or a photodiode. Since the delay between the pump and probe can be controlled to femtosecond
precision, an effective "movie" of the plasma dynamics can be generated. A myriad of applications follow naturally, including the characterization
of nanostructures [34] and
fundamental biochemical processes [35],
to name a few.
It's a bit like filming molecular movies \(-\) a novel art enabled by ultrafast science.
References
[1]
W. E. Lamb Jr., "Theory of an optical laser", Phys. Rev. 134, A1429 (1964).
[2]
D. Strickland and G. Mourou, "Compression of amplified chirped optical pulses", Opt. Commun. 56, 219 (1985).
[3]
R. Boyd, Nonlinear Optics (Elsevier Science, 2003).
[4]
J. Kasparian, R. Sauerbrey, and S. L. Chin, "The critical laser intensity of self-guided light filaments in air",
Appl. Phys. B 71, 877 (2000).
[5]
A. Braun, G. Korn, X. Liu, D. Du, J. Squier, and G. Mourou, "Self-channeling of high-peak-power femtosecond laser pulses in air", Opt. Lett. 20
, 73 (1995).
[6]
B. La Fontaine, F. Vidal, Z. Jiang, C. Y. Chien, D. Comtois, A. Desparois, T. W.
Johnston, J.-C. Kieffer, H. Pépin, and H. P. Mercure, "
Filamentation of ultrashort pulse laser beams resulting from their propagation over long distances in air
", Phys. Plasmas 6, 1615 (1999).
[7]
H. Pépin, D. Comtois, F. Vidal, C. Y. Chien, A. Desparois, T. W. Johnston, J. C."
Kieffer, B. La Fontaine, F. Martin, F. A. M. Rizk, "Triggering and guiding high-voltage large-scale leader discharges with sub-joule ultrashort laser pulses",
Phys. Plasmas 8, 2532 (2001).
[8]
M. Clerici, Y. Hu, P. Lassonde, C. Milián, A. Couairon, D. N. Christodoulides,
Z. Chen, L. Razzari, F. Vidal, F. Légaré, D. Faccio and R. Morandotti, "Laser-assisted guiding of electric discharges around objects",
Sci. Adv. 1, e140011 (2015).
[9]
P. Q. Elias, N. Severac, J. M. Luyssen, Y. B. André, I. Doudet, B. Wattellier, J. P. Tobeli, S. Albert,
B. Mahieu, R. Bur, A. Mysyrowicz, and A. Houard, "Improving supersonic flights with femtosecond laser filamentation",
Sci. Adv. 4, eaau5239 (2018).
[10]
S. L. Chin, S. A. Hosseini, W. Liu, Q. Luo, F. Théberge, N. Aközbek, A. Becker,V. P. Kandidov, O. G. Kosareva,
and H. Schröeder, "The propagation of powerful femtosecond laser pulses in opticalmedia: physics, applications, and new challenges",
Can. J. Phys. 83, 863 (2005).
[11]
A. Couairon and A. Mysyrowicz, "Femtosecond filamentation in transparent media", Phys. Rep. 441, 47 (2007).
[12]
H. Liang, D. L. Weerawarne, P. Krogen, R. I. Grynko, C.-J. Lai, B. Shim,
F. X. Kärtner, and K.-H. Hong, "Mid-infrared laser filaments in air at a kilohertz repetition rate",
Optica 3, 678 (2016).
[13]
H. Liang, P. Krogen, R. Grynko, O. Novak, C.-L. Chang, G. J. Stein, D. Weerawarne, B. Shim, F. X. Kärtner,
and K.-H. Hong, "
Three-octave-spanning supercontinuum generation and sub-two-cycle self-compression of mid-infrared
filaments in dielectrics
", Opt. Lett. 40, 1069 (2015).
[14]
P. Rairoux, H. Schillinger, S. Niedermeier, M. Rodriguez, F. Ronneberger, R. Sauerbrey, B. Stein, D. Waite,
C. Wedekind, H. Wille, and L. Wöste, "Remote sensing of the atmosphere using ultrashort laser pulses",
Appl. Phys. B 573, 71 (2000).
[15]
H. Takara, T. Ohara, T. Yamamoto, H. Masuda, M. Abe, H. Takahashi, and T. Morioka, "
Field demonstration of over
1000-channel DWDM transmission with supercontinuum multi-carrier source
", Elect. Lett. 41, 270 (2005).
[16]
T. Udem, R. Holzwarth, and T. W. Hänsch, “Optical frequency metrology”, Nature 416, 233 (2002).
[17]
I. Hartl, X. D. Li, C. Chudoba, R. K. Ghanta, T. H. Ko, J. G. Fujimoto, J. K. Ranka, and R. S. Windeler,
“
Ultrahigh-resolution optical coherence tomography using continuum generation in an air-silica
microstructure optical fiber
”, Opt. Lett. 26, 608 (2001).
[18]
A. Labruyère, A. Tonello, V. Couderc, G. Huss, and P. Leproux,
“Compact supercontinuum sources and their biomedical applications”, Opt. Fiber Technol. 18, 375 (2012).
[19]
R. R. Alfano, The Supercontinuum Laser Source (Springer-Verlag, 2006).
[20]
T. Popmintchev, M.-C. Chen, D. Popmintchev, P. Arpin, S. Brown, S. Ališauskas, G. Andriukaitis, T. Balčiunas,
O. D. Mücke, A. Pugžlys, A. Baltuška, B. Shim, S. E. Schrauth, A. Gaeta, C. Hernández-García, L. Plaja, A. Becker, A. Jaron-Becker, M. M. Murnane, H. C. Kapteyn, "
Bright Coherent Ultrahigh Harmonics in the keV X-ray Regime from
Mid-Infrared Femtosecond Lasers
", Science 336, 1287 (2012).
[21]
L. Nugent-Glandorf, M. Scheer, D. A. Samuels, A. M. Mulhisen, E. R. Grant, X. Yang, V. M. Bierbaum, and S. R. Leone,
"Ultrafast Time-Resolved Soft X-Ray Photoelectron Spectroscopy of Dissociating Br2",
Phys. Rev. Lett. 87, 193002 (2001).
[22]
M. Hohenleutner, F. Langer, O. Schubert, M. Knorr, U. Huttner, S. W. Koch,
M. Kira, and R. Huber, "Real-time observation of interfering crystal electrons in high-harmonic generation",
Nature 523, 572 (2015).
[23]
B. A. Malomed, D. Mihalache, F.Wise, and L. Torner, "Spatiotemporal optical solitons",
J. Opt. B 7, R53 (2005).
[24]
Couairon Arnaud, J. Biegert, C. P. Hauri, W. Kornelis, F. W. Helbing, U. Keller, and A. Mysyrowicz, "Self-compression of ultra-short laser pulses down to one optical cycle by filamentation",
J. Mod. Opt. 53, 75 (2006).
[25]
L. Bergé, "Self-compression of 2 µm laser filaments", Opt. Express 16, 21529 (2008).
[26]
C. Hernández-García, J. A. Pérez-Hernández, T. Popmintchev, M. M. Murnane, H. C. Kapteyn, A. Jaron-Becker, A. Becker,
and L. Plaja, "Zeptosecond High Harmonic keV X-Ray Waveforms Driven by Midinfrared Laser Pulses",
Phys. Rev. Lett. 111, 033002 (2013).
[27]
J. Muybridge, "The Horse in Motion", Nature 25, 605 (1882).
[28]
John Sanford (February 12, 2003). "Cantor exhibit showcases motion-study photography". Stanford Report.
[29]
E. Esarey, C. B. Schröeder, and W. P. Leemans, "Physics of laser-driven plasma-based electron accelerators",
Rev. Mod. Phys. 81, 1229 (2009).
[30]
M. Tabak, J. Hammer, M. E. Glinsky,W. L. Kruer, S. C.Wilks, J.Woodworth, E. M.
Campbell, M. D. Perry, and R. J. Mason, "Ignition and high gain with ultrapowerful lasers",
Phys. Plasmas 1, 1626 (1994).
[31]
C. W. Siders, S. P. Le Blanc, A. Babine, A. Stepanov, A. Sergeev, T. Tajima, and
M. C. Downer, "
Plasma-based accelerator diagnostics based upon longitudinal interferometry with
ultrashort optical pulses
", IEEE Trans. Plasma Sci. 24, 301 (1996).
[32]
K. Y. Kim, I. Alexeev, and H. M. Milchberg, "Single-shot supercontinuum spectral interferometry",
Appl. Phys. Lett. 81, 4124 (2002).
[33]
Z. Li, C.-H. Pai, Y.-Y. Chang, R. Zgadzaj, X. Wang, and M. C. Downer, "
Single-shot visualization of evolving,
light-speed structures by multiobject-plane phase-contrast imaging
", Opt. Lett.
38, 5157 (2013).
[34]
S. Link, C. Burda, M. B. Mohamed, B. Nikoobakht, and M. A. El-Sayed, "
Femtosecond transient-absorption dynamics of colloidal gold nanorods: Shape independence of the electron-phonon
relaxation time
", Phys. Rev. B 61, 6086
[35]
T. E. Matthews, J. W. Wilson, S. Degan, M. J. Simpson, J. Y. Jin, J. Y. Zhang, and W. S. Warren, "In vivo and ex vivo epi-mode pump-probe imaging of melanin and microvasculature",
Biomed. Opt. Express 2, 1576 (2011).